

Step 3 · Do the real work
Claim a live ticket. Investigate it like an analyst.
This is the doorway to your SOC console — two desks working together: SOC Queue, where live tickets wait under an SLA clock, and Investigations, where the case you claimed gets worked, contained and reported.
Your path
Step 1 of 4 — Check an email
- 1Check an email
Paste a suspicious email and read the verdict. Two minutes, no account.
- 2Learn the components
See what a header, link, attachment and message body actually tell you.
- 3Work your first ticket
Pick a reported email from the queue and investigate it yourself.
- 4Write the report
Say what happened, what you found and what should be done about it.
What you'll see inside
Two desks, one workflow
When you enter the console you land on a queue of live tickets and a board of the cases you own. Triage first, then investigate — the same rhythm a real SOC runs on every shift.
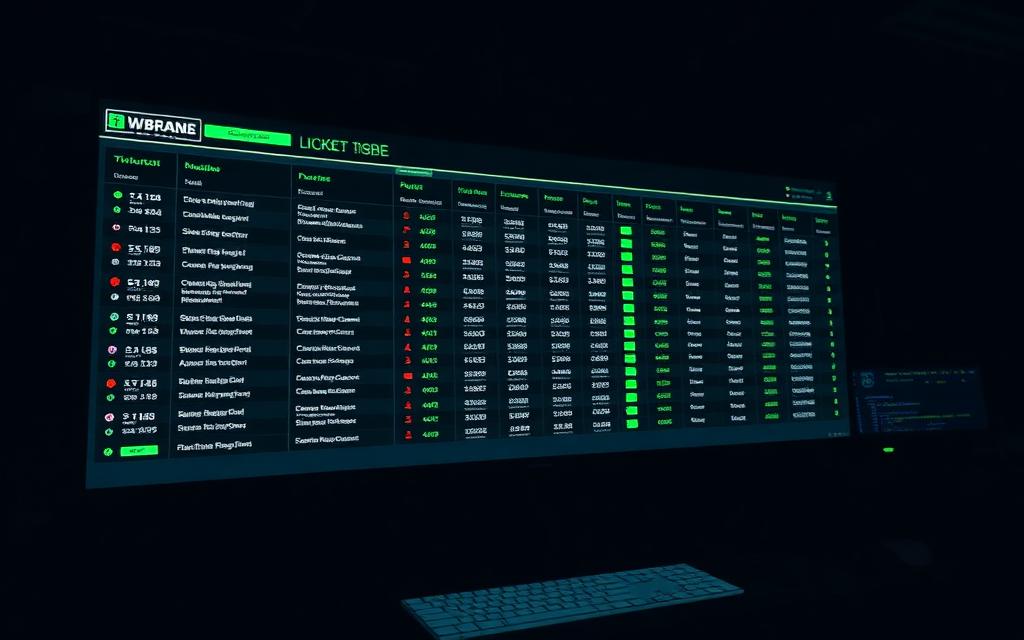
SOC Queue
Live tickets under SLA pressure. Everything reported and unclaimed lands here — filter by severity, department and clock, then claim what matters most.

Investigations
The cases you claimed. This is where the real work happens: evidence, tools, containment decisions and the incident report you export at the end.
From queue to closed case
Exactly what happens after you click through — step by step.
Pick a ticket in SOC Queue
The queue is the shared triage desk. Sort by severity and SLA, read the reporter's note, and claim the one you should work first.
It moves into Investigations
A claimed ticket becomes your case. Review the email, flag components, then pivot through headers, URLs, attachments, identity and endpoint.
Decide and contain
Classify, escalate or contain from inside the case. Every action needs confidence, written rationale and the evidence behind it.
Report and get scored
Close the case with an incident report built from your own notes, then get debriefed the way a senior analyst would score you.
Workspaces you'll pivot through
Every indicator you capture, defanged, deduped, tagged and exportable as CSV or JSON.
Sign-in logs, impossible travel, OAuth grants, inbox rules and session revocation.
EDR alerts, process trees, persistence, PowerShell activity and host isolation.
Email, identity, endpoint and network actions — each one needs a written rationale.
Hashes and chain-of-custody notes captured as you work, not bolted on afterwards.
Generated from your own work, editable, exportable with the full IOC list.
Next step
Your console is one click away.
Open SOC Queue to claim a ticket, or go straight to Investigations to continue a case you already own.